Element Measurement:
It can measure 12 types of elements (points, lines, circles, arcs, ellipses, rectangles, grooves,○-shaped rings, distances, angles, open cloud lines, and closed cloud lines).
Characteristic:
The system offers diverse measurement methods (automatic identification measurement, point sampling measurement, comparative measurement, tolerance comparative measurement, and preset element measurement), catering to various user requirements while significantly enhancing both usability and measurement accuracy.
There are several single-point collection methods: point selection using a mouse, point selection via crosshair alignment, and point selection through zooming.
It can measure the perimeter, area, and center of gravity of closed cloud lines using a cubic interpolation algorithm, making it the most accurate method for cloud line measurement currently available. The system supports frame selection for measuring multiple circles, enabling rapid and precise single-measurement of multiple circles.
The measured data can be saved as DXF files, BMP images, or user-defined program formats.
Macro Measurement Function:
The macro measurement feature links various measurement construction commands to a single button. Clicking the button initiates the macro measurement function, which automatically completes the construction actions, reducing user mouse interactions and improving work efficiency.
Note: Macro measurement differs from user program functions; it does not record measurement parameters such as light sources or coordinate positions. When running macro measurement, the workbench or lighting setup will not be moved. The software provides 16 sets of macro measurement functions, and users can customize the icons for macro measurement buttons. The interface for macro measurement is shown below.
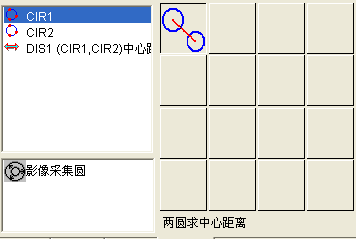
In addition to macro measurement, the translation and replication features of our company's software are also well-developed.
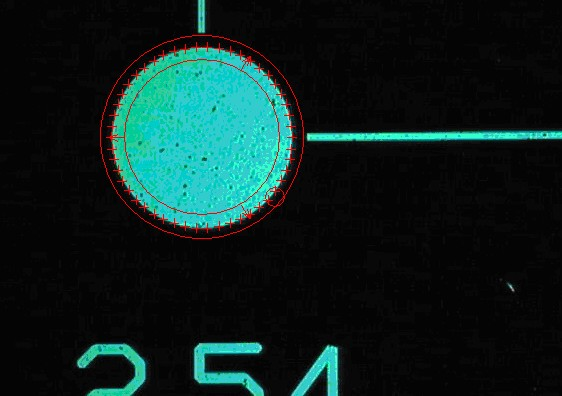
Automatic Circle Capture: Click the circle icon to automatically draw a circle. The circle will be automatically framed.
Element Construction:
Element construction is highly powerful. It offers 10 construction methods ([Translation], [Rotation], [Extraction], [Combination], [Parallel], [Perpendicular], [Mirror], [Symmetry], [Intersection], and [Tangent]) for creating geometric elements. Element construction enables users to easily handle elements that are difficult to measure, thereby improving work efficiency.
Construction elements are element-type oriented. When multiple construction results are available, users can choose from various options. For example, constructing a line from two points allows connecting the points to form a straight line or calculating their symmetrical line—there are thus two construction methods. The software displays the following interface:
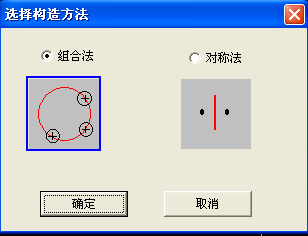
Use the combination method, click OK, and connect the two points.
Select the symmetry method, click OK to calculate the symmetry line between two points.
The results are rich:
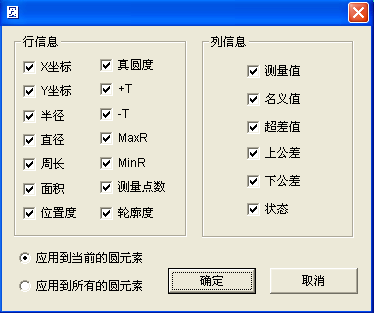
The measurement results for various elements provide rich information that meets the needs of diverse clients. Users can customize which content to display or hide, configure display settings for individual elements, or apply uniform settings to similar elements. The following figure shows the display settings dialog for circular elements.
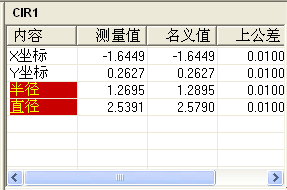
The dimension exceeds the tolerance range and displays red. When a nominal value (accurate value) and upper/lower tolerances are specified, the item turns red if the actual measurement exceeds the set tolerance, and the entire product is deemed defective (NG).
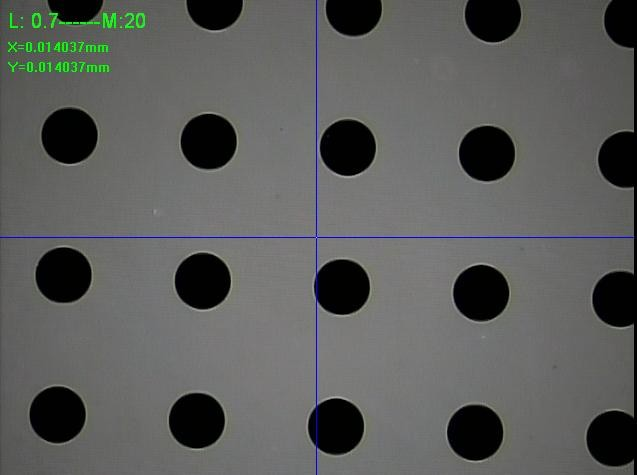
The measurement interface displays the current objective lens magnification and the actual magnification:
The figure below shows the optical magnification and screen magnification. The screen magnification is automatically calculated by the axis software and indicates how many mm correspond to one pixel.
Coordinated system:
Multiple workpiece coordinate systems can be established based on the drawings, enabling coordinate transformations between different systems. The system facilitates easy conversion between Cartesian and polar coordinate systems, and supports the storage and retrieval of various workpiece coordinate systems. The figure below shows the graphical representation after establishing two coordinate systems.
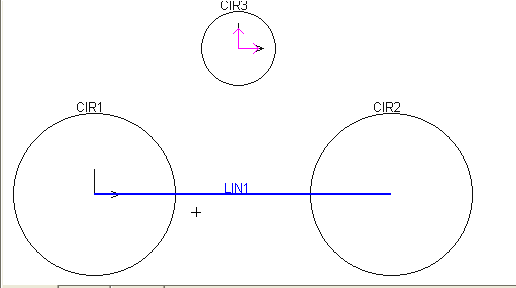
After establishing the coordinate system, if the crosshair rotation function is selected, the crosshair will rotate to indicate the direction of the coordinate system's rotation.
User program:
Unrestricted functionality for recording, editing, saving, and retrieving user program data. The user program can log and edit all user actions, enabling automated measurement replication and significantly improving measurement efficiency.
A simple user-friendly tutorial method allows for replicating teaching steps, complemented by powerful visual editing features that facilitate batch detection.
Use the instruction program mode to record user programs. When measuring a workpiece for the first time, the system automatically records the corresponding user program. The recorded program can be saved to the computer for subsequent reuse.
The intelligent direction indicator shows the location of the next element to measure, helping users locate their target.
You can configure whether autofocus is enabled during the execution of user programs, and manual measurements can be performed during automatic measurement.
You can remeasure an element to change its measurement method, or edit and modify its measurement scale, light source, edge detection direction, and other settings.
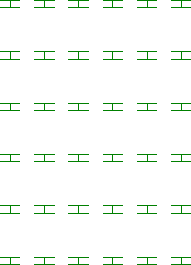
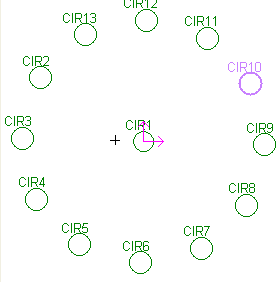
The figure below shows two user programs created using translation and rotation:
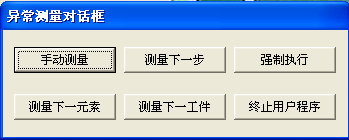
The software provides pause functions for out-of-tolerance and measurement failure. If measurement anomalies occur during user program execution, the software handles them intelligently—for example, if the sample piece moves, a dialog box appears prompting the user to make a selection.
Auto-focusing:

To obtain clear images, the lens must be focused using the software's computational capabilities to achieve sharp imaging through autofocus. The software's autofocus function includes both precision and rapid focusing modes, which determine focus by measuring height values or obtaining current point coordinates automatically.
Auxiliary dimming:
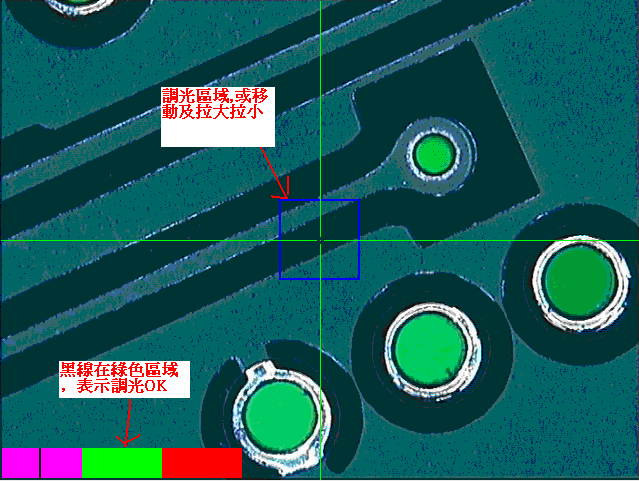
The dimming indicator informs users when the optimal light intensity is achieved, eliminating measurement errors caused by lighting variations and enhancing both measurement accuracy and efficiency.
Program-controlled light source:
Supports programmable light sources from 1×8 to 5×8 zones. Supports full-on, ring-on, zone-on, and segment-on control modes.
Multiple motion control modes:
The software offers seven motion control modes to facilitate worktable movement, including:
Move the workbench using the operation box.
Click the middle mouse button in the image window.
Hold the right mouse button in the image window to move.
Click the middle mouse button in the graph window.
In the element list window, select the element, right-click, and move it here.
Click the left mouse button in the motion control window to move.
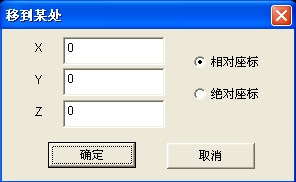
Right-click the image window, select Move, and enter coordinate values to move. The image below shows entering coordinate values for movement.
Graphic Functions:
It features comprehensive graphics processing and display capabilities (zooming, panning, window display, local magnification, full-screen display), making measurement results more visual and intuitive for user operation. Pressing and holding the middle mouse button while moving the cursor zooms in/out on the graphics, while moving the mouse without releasing the button moves the graphics.
Standard Functions:
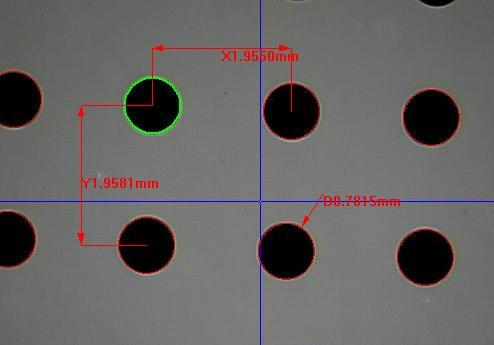
You can directly annotate angles, distances, X-direction distances, Y-direction distances, circle (arc) radii, circle (arc) diameters, and arc lengths on element graphics in the drawing and image areas, making them immediately clear to users.
The image window and drawing window can display measured elements and annotations simultaneously. You can hide the graphics drawn in the image window and delete them concurrently, or select graphic elements from both the image window and the 2D graphics window. The figure below shows the X-and Y-direction distances between two circles and their radii.
When generating reports, you can output only the annotated elements.
Systematic error correction:
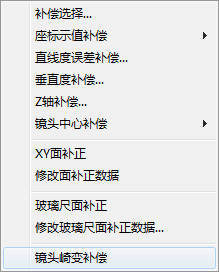
The software features systematic error correction functionality. It currently compensates for coordinate positioning system errors, perpendicularity system errors, Z-axis straightness errors, lens center offset, straightness errors, and lens distortion. For coordinate positioning system error compensation, options include linear compensation, segment compensation, XY plane correction, and glass scale plane correction.
The figure below shows the system error compensation menu.
Common difference:
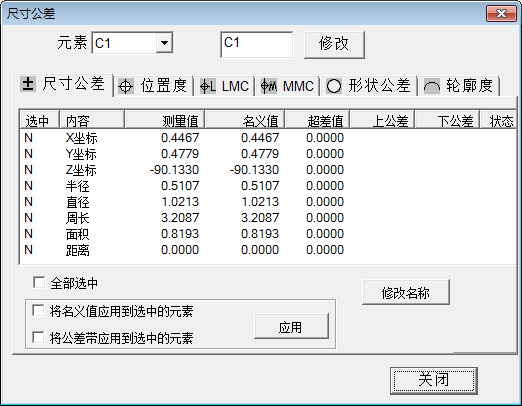
Advanced dimensional tolerance calculation capabilities. It supports default tolerance zones compliant with national standards, enabling calculations of shape tolerances, true straightness, and true roundness for circles and arcs. Position tolerance calculations include positional accuracy, parallelism, perpendicularity, inclination, concentricity, and symmetry. Out-of-tolerance conditions trigger automatic alerts with red warnings. The figure below shows the circular dimensional tolerance input dialog box.
Import programming for DXF, TXT, and Gerber files:
After importing the DXF file, the software guides the user through step-by-step operations. Once the workpiece coordinate system is established, the user-defined program is completed. The software automatically generates the nominal values for each element. When running the program, it compares the DXF file with the image texture. The import process for TXT and Gerber files follows a similar procedure, which will be detailed later.
Scan Function:
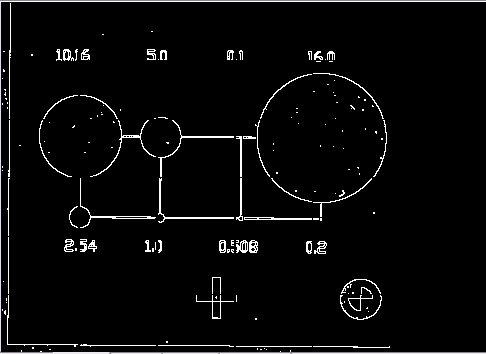
The system can scan points along the edges of the workpiece across multiple regions. This scanning process captures all points on the edges within the image window, generating point data that is saved as a DXF file. The figure below shows the graphical representation obtained from the comprehensive edge scanning of the entire workpiece:
Big Map Feature:
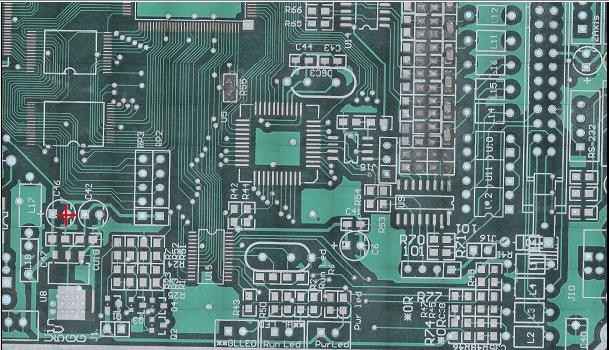
The workpiece can be divided into multiple areas for photography, creating a comprehensive map where annotations can be made. The image below shows the full PCB layout that supports annotations on the map; click and hold the middle mouse button to move to the desired location.
Array measurement:
Place multiple identical workpieces on the worktable to measure all of them simultaneously—this is array measurement. The software supports rectangular and circular array configurations.
Outline scan:
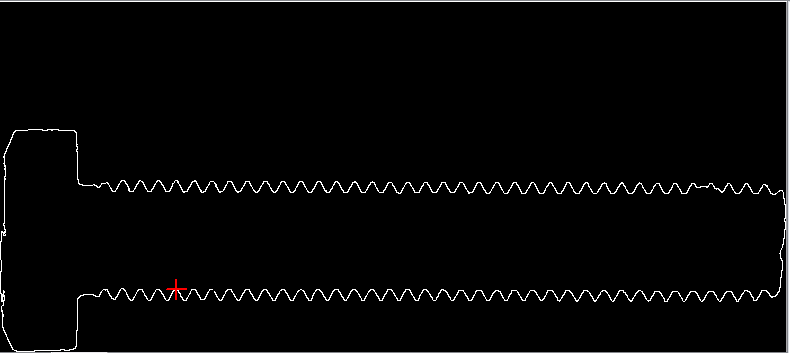
Contour scanning: This function scans only the specified workpiece contour, applicable to both open and closed contours. It supports regular shapes such as circles, arcs, lines, and ellipses, as well as irregular open and closed cloud lines, generating point data. This feature is particularly useful for scanning large workpieces, enabling CNC machines to rapidly obtain the workpiece contour. The image below shows the result of contour scanning:
Language transformation:
The three pre-configured screen language options— "Simplified Chinese," "Traditional Chinese," and "English" —now meet the needs of the vast majority of users. The system's default language matches the operating system. Users can switch between Chinese and English via the "Parameter Settings" menu. Additional languages can be configured through the computer system.
Report Function:
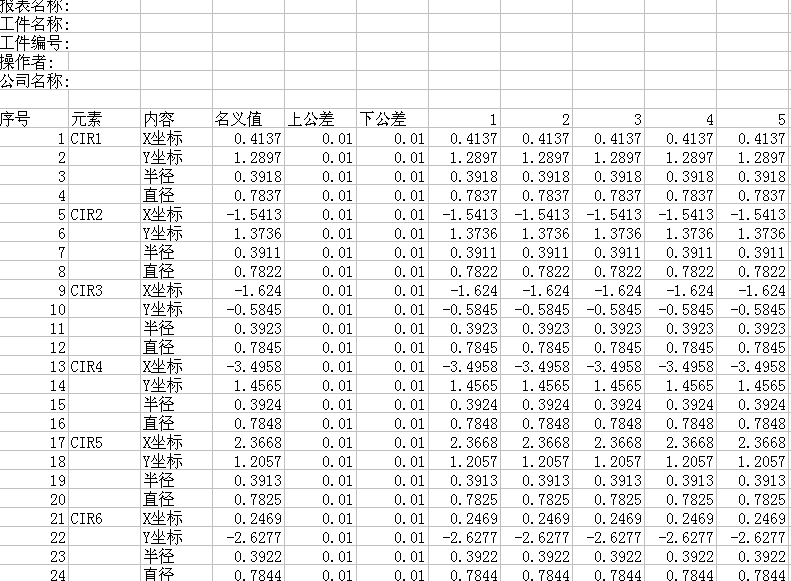
Measurement data can be exported to Excel, Word, AutoCAD, and TXT formats. When running user programs, data can be imported into Excel either horizontally or vertically. When importing into reports, you can choose whether to export charts and bitmaps.
The image below shows the report generated after five measurements of the same workpiece, automatically exported to Excel:
SPC function:
We provide independent, professional SPC software for subsequent processing of measurement data. The measurement software seamlessly integrates with the SPC software, automatically importing data into the SPC database after measurements are completed—eliminating the need for manual entry. All control limit settings are configured within the measurement software, eliminating the need for additional configuration in the SPC software and significantly improving efficiency. SPC offers control charts for both process monitoring and analysis, including: Mean Range Control Chart, Mean Standard Deviation Control Chart, Median Range Control Chart, Outlier and Moving Average Control Chart, Histogram, CPK Moving Average Chart, Specification Standard Deviation Control Chart, Process Standard Deviation Control Chart, Standard Deviation Comparison Chart, and Process Recommendation Analysis Chart. The generated charts can be evaluated using eight predefined decision rules. The charts and data are printable and importable into Excel.